
CLN - Feature

More than 1 in 3 U.S. adults (approximately 86 million people) are at risk for developing chronic kidney disease (CKD), and more than 1 in 7 (37 million) already have it (1). Yet many of these individuals have no idea they have the condition. Often dubbed a “silent killer” due to a lack of physical symptoms until later stages, CKD can lurk undetected — and thus untreated — for years. In fact, roughly one-third of patients with severe CKD aren’t aware that anything is wrong.
Fortunately, we have the tools to change that. Clinical guidelines now recommend using validated, lab-based equations that predict kidney-failure risk as an essential part of CKD management. While most patients with CKD have early-to-mid stages (G1–G3), a minority will progress to kidney failure. Having a way to assess each patient’s risk of disease progression enables clinicians to make better treatment decisions and engage in informed discussions with patients and their families.
As the developers of the kidney-failure risk equation (KFRE) (2,3), a highly accurate, lab-based equation for predicting kidney-failure risk in patients with CKD stages G3-G5, we make the case in this article for taking an individualized approach to risk assessment when evaluating and managing patients with CKD.
This strategy, which builds on the current CKD risk-staging system (heatmap) to provide more personalized information, was recently emphasized in the 2024 guidelines from KDIGO (Kidney Disease: Improving Global Outcomes). What’s more, the integration of risk equations into labs’ automated reporting systems has the potential to usher in a new era in CKD management, with laboratory professionals leading the way toward more precise clinical decision support.
Currently, the diagnosis of CKD is based on estimated glomerular filtration rate (eGFR) using markers such as serum creatinine and the presence of albumin in the urine (4). Both serum creatinine and the urine albumin-to-creatinine ratio are required to diagnose, stage, and prognosticate CKD (4).
Current guidelines from the National Kidney Foundation’s Kidney Outcomes Quality Initiative (KDOQI) recommend using the race-free Chronic Kidney Disease Epidemiology Collaboration (CKD-EPI-2021) equation (5) to calculate eGFR (6). (The previous use of a race multiplier — which required inputting whether a patient was African-American — in eGFR equations came under scrutiny for its lack of recognition that race is a social construct rather than a biological one, prompting the recent development of a race-free equation.)
When it comes to using eGFR to help define CKD, most nephrologists rely on clinical practice guidelines from the global nonprofit organization KDIGO, which formally defines CKD as the presence of abnormalities of kidney structure or function and a reported eGFR <60 mL/min/1.73m2 for 3 months or more, irrespective of cause (7). Abnormality in kidney function can be determined by the presence of albuminuria, which is defined as an albumin-to-creatinine ratio (ACR) in urine of ≥30mg/g (≥3 mg/mmol) (7).
Using eGFR and albuminuria values, the KDIGO guidelines classify CKD into five eGFR-based stages (G1-G5) and three albuminuria-based stages (A1-A3) (8).
Risk for adverse clinical outcomes (kidney failure, all-cause mortality, cardiovascular events, and acute kidney injury) can then be visualized as a grid of colored squares across the two axis variables (eGFR and albuminaria), forming a heatmap. Green squares indicate low risk; yellow and orange show intermediate and high risk, respectively; and red reflects very high risk (Figure 1) (8). The diagonal distribution of risk reflects the equal importance of both low eGFR and high levels of albuminuria in increasing a person’s likelihood for disease progression.
While the heatmap is a useful tool, it’s important to remember that the squares reflect only relative risk. In other words, patients in red, orange, or yellow squares of the heatmap have higher risks of kidney failure on average than those in green squares, but there is still considerable variability in the risk of CKD progression within each color group. Two patients in the same square can have up to a 40-fold difference in their 5-year risk of kidney failure, with Patient A having a 1-2% risk and Patient B having a risk up to 80% (7).
This is where individualized risk assessment can make a difference. Accurate, validated risk equations address this variability by providing a more nuanced risk assessment for each patient.
One such equation is the KFRE, a predictive model used in outpatient clinical settings to assess the 2- and 5-year risk of kidney failure in patients with stages G3-G5 CKD. The KFRE is the most widely used prediction model in clinical practice for patients with kidney disease (2,3).
We developed this equation in 2011 and subsequently validated it in 2016 in more than 30 countries and 700,000 individuals (9). Since then, the KFRE has been proven accurate across diverse populations and validated in more than 50 countries.
The probability of kidney failure in the next five years for patients with CKD Stages G3-G5 can be calculated using one of two KFREs (2,3): the 4-variable or 8-variable KFRE model. The 4-variable model uses age, sex, eGFR, and urine ACR to calculate kidney failure risk (2,3), while an 8-variable model includes additional laboratory values of serum albumin, bicarbonate, calcium, and phosphorus (2,3).
Because the performance of the two models is similar in most healthcare settings, the simpler 4-variable model is preferred for broad implementation (10).
In 2021, the United Kingdom’s National Institute for Health and Care Excellence (NICE) updated its guidelines to incorporate the KFRE in their referral criteria for patients with CKD (11). These guidelines outline key thresholds to guide clinical decisions based on the patient’s calculated risk score (11). NICE recommends that adults with CKD be referred to a nephrologist if their 5-year kidney failure risk is greater than 5%, as measured using the 4-variable KFRE (11).
These thresholds also are used in clinical practice guidelines and pathways in Canada and several other health jurisdictions.
KDIGO’s 2024 guidelines strongly emphasize taking a personalized approach to CKD management that includes estimating risk using a validated prediction equation like the KFRE for all patients with CKD Stages G3–G5 (1A Recommendation) (7).
In addition, the guidelines endorse a risk-based approach to care and clinical decision-making that complements the eGFR-based strategy and favors:
The KDIGO guidelines represent a paradigm shift in CKD care. Rather than basing clinical decisions solely on eGFR values, clinicians can use a patient’s individual risk of progression to guide their approach around nephrology care or kidney replacement therapy (dialysis or transplant). KDIGO strongly recommends that laboratory services providers, primary care providers, and electronic health records manufacturers integrate validated risk equations like the KFRE to facilitate risk-based care for patients (7).
We believe that clinical laboratories can and should automatically report KFRE scores for patients with eGFR values of ≤60 mL/min/1.73m2 and available albuminuria data. There are many benefits to doing this, including:
Overcoming EMR Challenges. Automated reporting of the KFRE by clinical laboratories serves as a potential solution to some of the challenges associated with varying electronic medical record (EMR) systems and software. For example, the KFRE is built into the base version of the EPIC Electronic Health Record (EHR) (12), but the equation is not accessible to all EPIC users, since some may be using older versions of the software.
Providing Clear Prognostic Information to Primary Care Providers. Primary care providers, who manage the majority of patients with CKD, are unlikely to keep pace with the latest clinical practice guidelines in every therapeutic area (13). Automated reporting would do this work for them. Tools like the KFRE display show the risk of CKD progression for all patients with CKD, irrespective of their care provider. This would eliminate extra steps towards manual calculation, since prediction models and their inputs/outputs often reside in a separate screen or view.
Offering a Leadership Role for Clinical Laboratories. Clinical laboratories already play a pivotal role in CKD care, given that the disease’s diagnosis, prognosis, and complications are largely defined using lab criteria. Laboratory professionals routinely optimize CKD care by reporting eGFR and standardizing serum creatinine and urine albumin measurements. In addition, as recently as 2021, they took the lead in updating the eGFR equations to incorporate race-free methods (5). Now, clinical laboratories have another opportunity to drive meaningful change by automating reporting of the KFRE, reinforcing their role as integral partners in CKD care delivery.
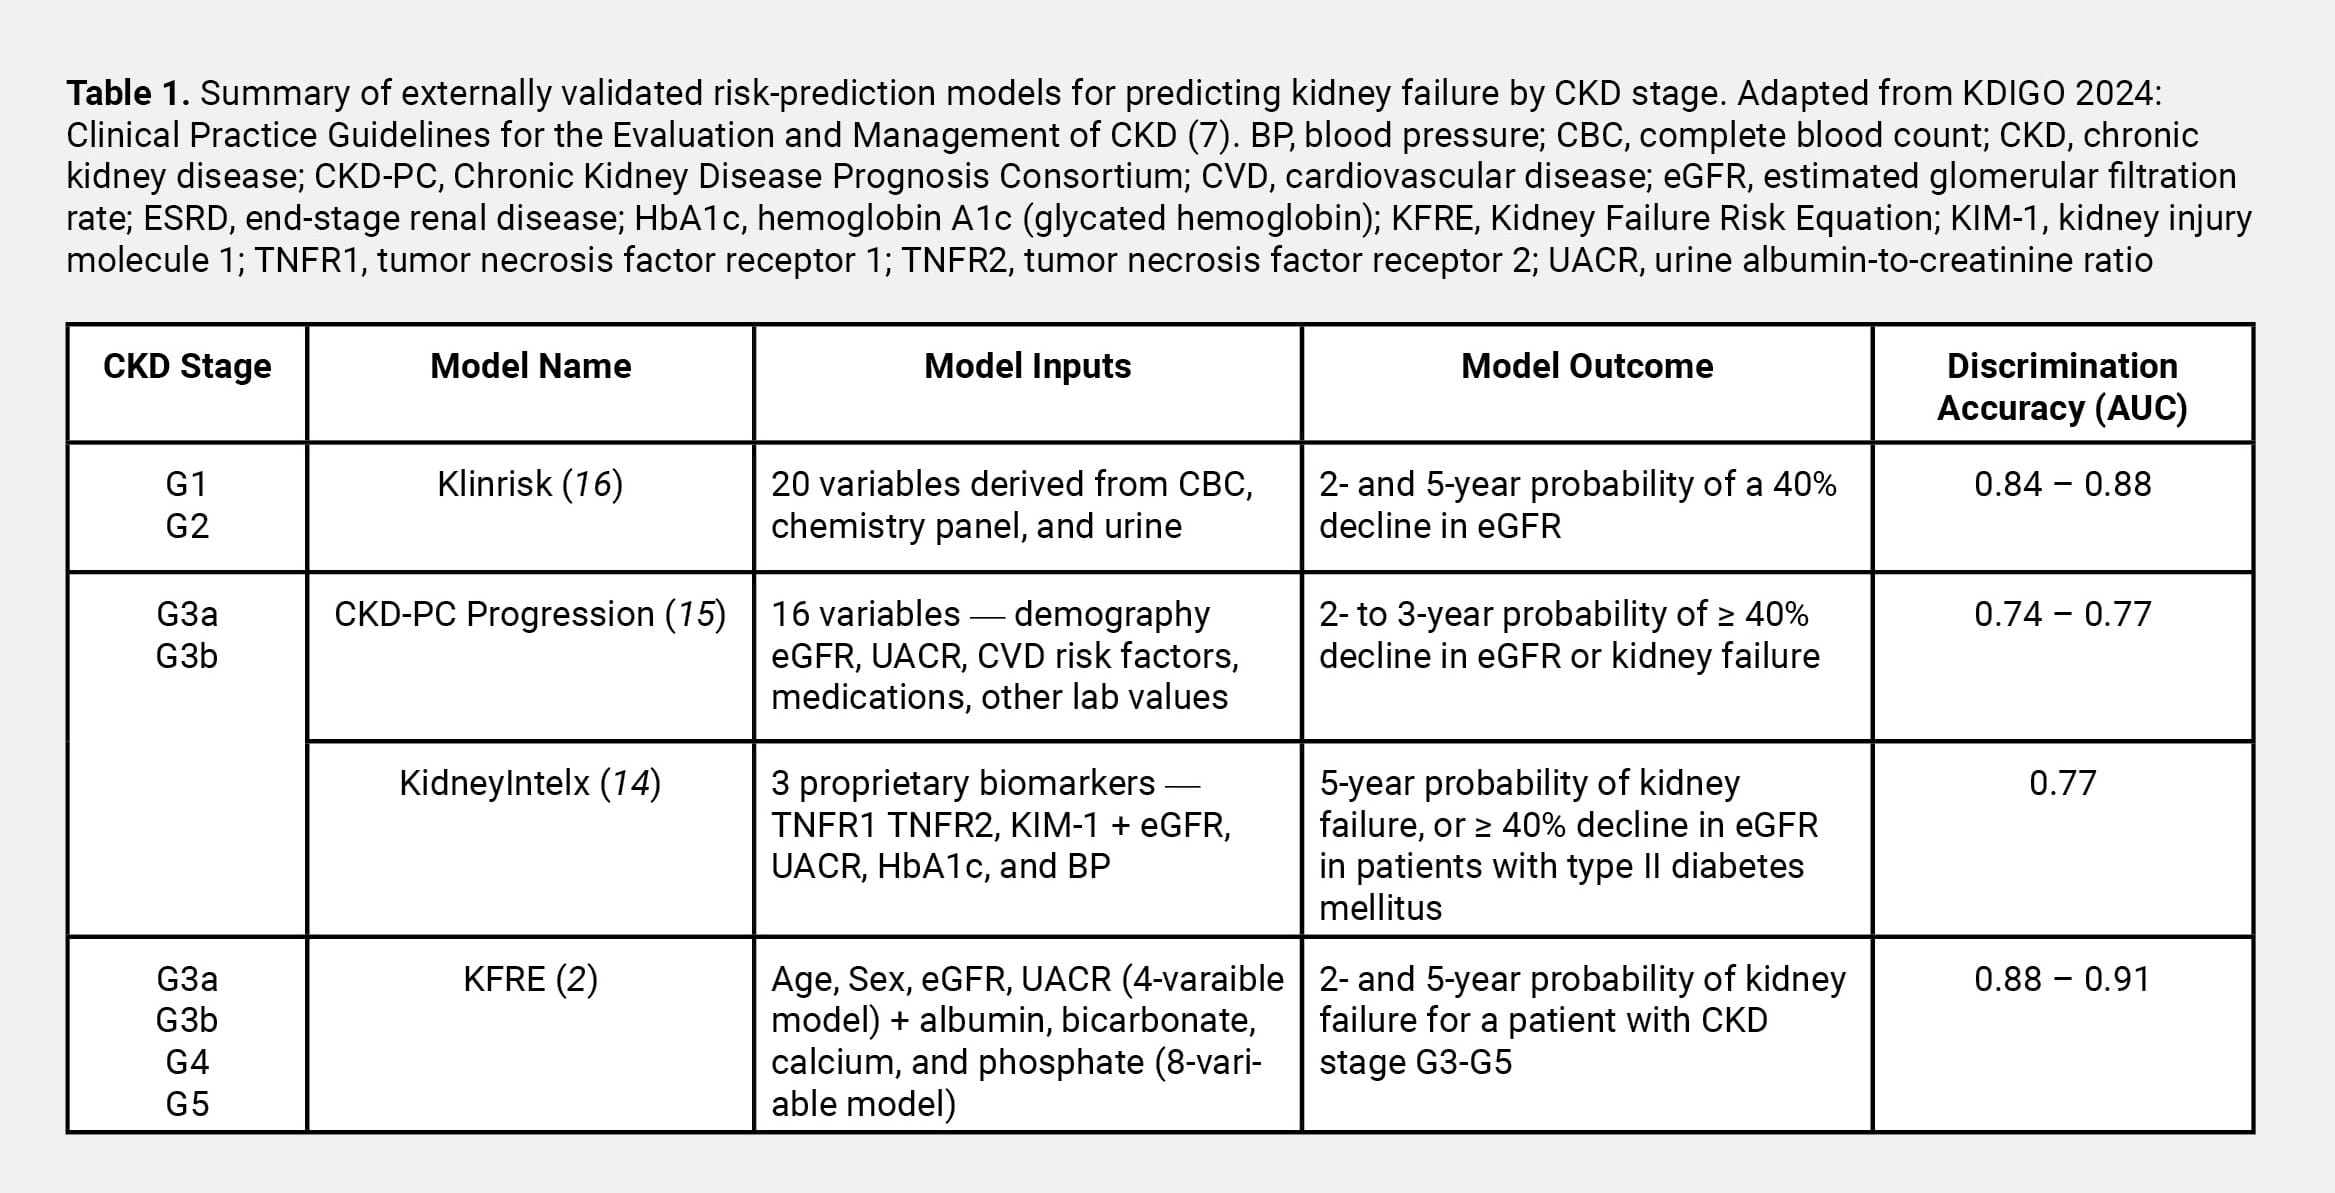
Although the KFRE has a wide evidence base and is strongly recommended for use in patients with CKD Stages G3-G5, the guidelines acknowledge the need for validated equations to identify patients in earlier stages of disease who are at risk for progression.
We and others have developed models that enable early intervention, including models that incorporate biomarkers (14), clinical and laboratory data (15), as well as those that rely solely on data collected in routine lab settings (16) (Table 1). As evidence builds for their use, labs can also consider offering these models to patients and providers, further supporting personalized care at all stages of CKD.
Although research is ongoing, it’s clear that both CKD patients and practitioners can benefit from better understanding individual risk of disease progression. Automated reporting of risk will usher in a new era in CKD management, where implementation will be aligned with evidence, and the clinical laboratory will play a key part in getting us there.
Heba Elgubtan, BHSc, is a master of science student in the department of community health sciences at the University of Manitoba, Winnipeg, Manitoba, Canada. +EMAIL: [email protected]
Navdeep Tangri, MD, PhD, FRCPC, is a professor in the department of internal medicine and community health sciences at the University of Manitoba, and a nephrologist at the Seven Oaks General Hospital Chronic Disease Innovation Centre, Winnipeg, Manitoba, Canada. +EMAIL: [email protected]
Read the full November/December 2024 CLN issue here.