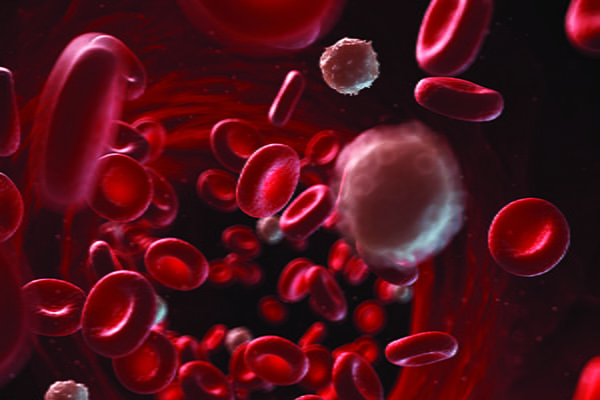
Both eXtreme Gradient Boosting (XGB) and logistic regression models can make highly accurate predictions about a broad range of hemoglobinopathies and differentiate them from iron deficiency anemia (IDA), according to recent research (Clin Chem 2024; doi: 10.1093/clinchem/hvae081).
Hemoglobinopathies affect 5.2% of people worldwide and account for 3.4% of deaths of children younger than 5, but they often remain undiagnosed. Meanwhile, migration drives rising prevalence in areas where malaria is not endemic. Early identification of carriers of genetic variations leading to hemoglobinopathies is important for counseling at-risk couples.
Laboratories use specific changes in complete blood count (CBC) parameters to recommend diagnostic testing for hemoglobinopathy, including reduced hemoglobin and mean corpuscular volume. CBC changes caused by hemoglobinopathies can mimic those caused by IDA. Misdiagnosis may result in unnecessary iron supplementation.
To improve this situation, the researchers developed and validated a new machine learning model intended to differentiate between various hemoglobinopathies and IDA. The model covered a wide spectrum of hemoglobinopathies and was based on CBC testing.
The researchers retrospectively extracted hemoglobinopathy test results from 10,322 adults at eight laboratories in the Netherlands. The researchers developed XGB and logistic regression models to differentiate negative from positive cases using seven routine CBC parameters. The researchers performed external validation on a dataset from an independent laboratory in the Netherlands. To specifically differentiate thalassemia from IDA, the researchers performed additional external validation on a previously published Spanish data set including 2,629 test results, mainly from cases with microcytic anemia.
In distinguishing negative from positive hemoglobinopathy cases in the independent external validation set, the XGB and logistic regression models achieved areas under the receiver operating curve (AOCs) of 0.88 and 0.84, respectively. Subclass analysis showed that the XGB model reached an AOC of 0.97 for ß-thalassemia, 0.98 for ɑ0-thalassemia, 0.95 for homozygous ɑ+-thalassemia, 0.78 for heterozygous homozygous ɑ+- thalassemia, and 0.94 for the structural hemoglobin variants hemoglobin C, hemoglobin D and hemoglobin E. Both models attained ROCs of 0.97 in differentiating IDA from thalassemia.
These results showcase the machine learning algorithms’ wide-ranging applicability in medical diagnostics, the researchers wrote.
Blood test for Alzheimer’s disease shows promise
Using predefined cutoff values, a new blood test showed high diagnostic accuracy for Alzheimer’s disease (AD) among individuals with cognitive symptoms in primary and secondary care, according to a recent study (JAMA 2024; doi:10.1001/jama.2024.13855).
The assay is based on the ratio of plasma phosphorylated tau 217 (p-tau217) relative to non–p-tau217 (expressed as percentage of p-tau217), combined with the amyloid-β 42 and amyloid-β 40 plasma ratio (the amyloid probability score 2 [APS2]).
The researchers prospectively evaluated the assay in 1,213 primary and secondary care patients undergoing cognitive evaluation. The biomarker cutoff values had been established in an independent cohort and were applied to 307 primary care patients and 300 secondary care patients. Patients’ mean age was 74.2, 48% were women, 23% had subjective cognitive decline, 44% had mild cognitive impairment, and 33% had dementia. In both the primary care and secondary care assessments, 50% of patients had AD pathology.
After analysis of a single batch of plasma samples in the primary care cohort using APS2, the AUC was 0.97 (95% CI, 0.95−0.99), the positive predictive value (PPV) was 91% (95% CI, 87%−96%), and the negative predictive value (NPV) was 92% (95% CI, 87%−96%). In the secondary care cohort, the AUC for APS2 was 0.96 (95% CI, 0.94−0.98), the PPV was 88% (95% CI, 83%−93%), and the NPV was 87% (95% CI, 82%−93%).
When the plasma samples were analyzed prospectively (biweekly) in the primary care cohort, the AUC was 0.96 (95% CI, 0.94−0.98) for APS2. APS2’s PPV was 88% (95% CI, 81%−94%), and it NPV was 90% (95% CI, 84%−96%). In the secondary care cohort, the AUC for APS2 was 0.97 (95% CI, 0.95−0.98), the PPV was 91% (95% CI, 87%−95%), and the NPV was 91% (95% CI, 87%−95%).
Primary care physicians had a diagnostic accuracy of 61% (95% CI, 53%−69%) for identifying clinical AD after clinical examination, cognitive testing, and a computed tomographic scan, versus 91% (95% CI, 86%−96%) using APS2. Dementia specialists using usual methods had a diagnostic accuracy of 73% (95% CI, 68%−79%), versus 91% (95% CI, 88%−95%) using the APS2. In the overall population, physicians’ diagnostic accuracy when using the APS2 (90% [95% CI, 88%−92%]) was similar to the diagnostic accuracy using the percentage of p-tau217 alone (90% [95% CI, 88%−91%]).
Although the blood test provided superior performance compared with standard clinical evaluation, studies should evaluate how the use of blood tests for these biomarkers influences clinical care, the researchers wrote.
Fifty new genetic links to kidney cancer identified
A recent genome-wide association study (GWAS) analysis identified 50 new areas across the genome associated with kidney cancer risk (Nat Genet 2024; doi.org/10.1038/s41588-024-01725-7).
A previous GWAS of people of European ancestry identified 13 regions of the genome associated with kidney cancer risk. In contrast, the current study involved participants of many different genetic ancestries, including 29,020 people with kidney cancer and 835,670 people without kidney cancer. Including the newly discovered regions, 63 are now associated with the risk of developing kidney cancer.
Among the newly identified genetic variants were several associated with a risk of papillary renal cell carcinoma, the second most common subtype of renal cell carcinoma. Another variant in the VHL gene was common in individuals of African ancestry and associated with an estimated three times higher risk of developing clear cell renal cell carcinoma, the most common type of kidney cancer.
The researchers used the study data to develop a polygenic kidney cancer risk score. Combined with established risk factors such as high blood pressure, smoking, and high body-mass index, the score may enable earlier detection.
The researchers add that their data may eventually aid understanding of the molecular basis of kidney cancer, inform screening efforts, and identify new drug targets.

